Secure Your School: Cybersecurity Guide for School Leaders

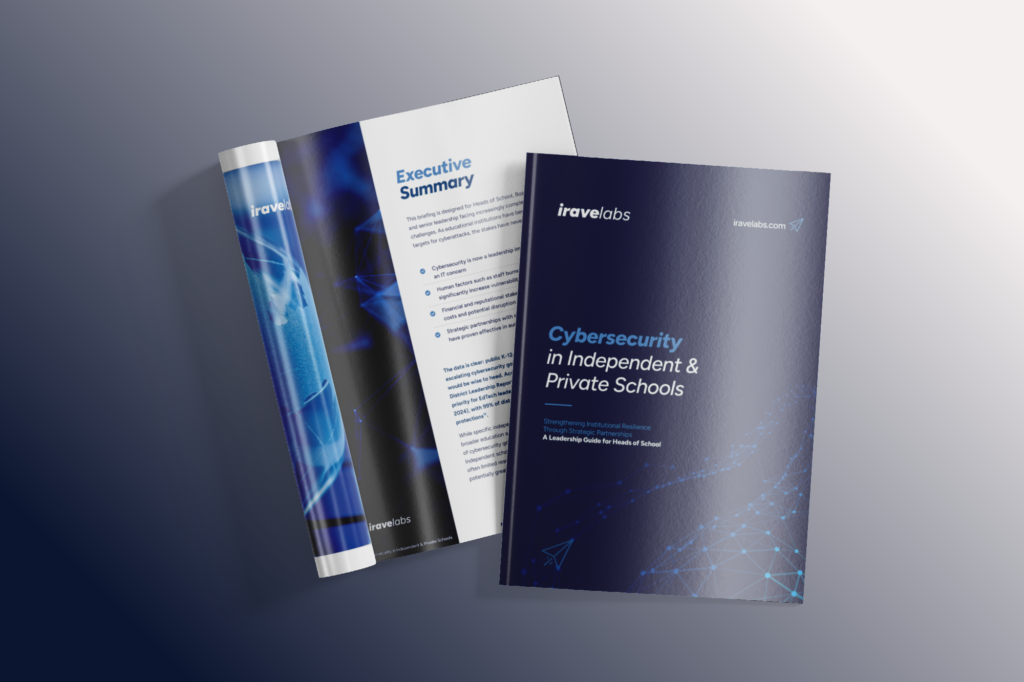
Our guide “Cybersecurity in Independent & Private Schools: Strengthening Institutional Resilience” offers research-backed insights specifically for educational leadership.
Exclusive Access:
Available only to Heads of School, Board Members, and Senior Leadership Teams
Delivered via password-protected Microsoft OneDrive links
A printed copy can be provided for DC Metro area schools
No forms required – simply connect with Steve via LinkedIn or contact us directly [email protected] to request a secure link to download.
Our approach is informed by Department of Education data on private schools.
Data source: U.S. Department of Education, National Center for Education Statistics, Private School Universe Survey (PSS), 2021–22
Note: This data is from the 2021-2022 school year and represents the most comprehensive publicly available dataset on private schools from the Department of Education.
View original data tablePrivate School Market Overview
The private school sector includes a diverse range of institutions with varying staff sizes and student populations.
Private School Segments by Size
Private schools vary significantly in their institutional profile and complexity:
| School Association | Number of Schools | Teachers per School | Students per School | Student-Teacher Ratio |
|---|---|---|---|---|
| NAIS Member Schools | 1,680 | 57.9 | 415.9 | 7.2:1 |
| Episcopal Schools | 260 | 42.4 | 318.3 | 7.5:1 |
| Girls' Schools Coalition | 143 | 57.0 | 431.9 | 7.6:1 |
| Catholic Schools | 4,613 | 23.8 | 281.6 | 11.8:1 |
| Christian Schools (ACSI) | 2,298 | 24.5 | 255.3 | 10.4:1 |
| Montessori Schools | 1,260 | 9.9 | 49.9 | 5.0:1 |
| Schools with No Association | 9,727 | 9.6 | 80.1 | 8.3:1 |
| ALL PRIVATE SCHOOLS | 29,727 | 17.7 | 159.2 | 9.0:1 |
Key Insight
Schools affiliated with NAIS, Episcopal associations, and Girls' School Coalition operate at a substantially larger scale, with:
- 3-6x more teachers per school than average
- 2-3x larger student populations
- Lower student-teacher ratios
These larger institutional profiles can create more complex digital environments with more users to protect.